Mirth Connect Monitoring Dashboard
Context
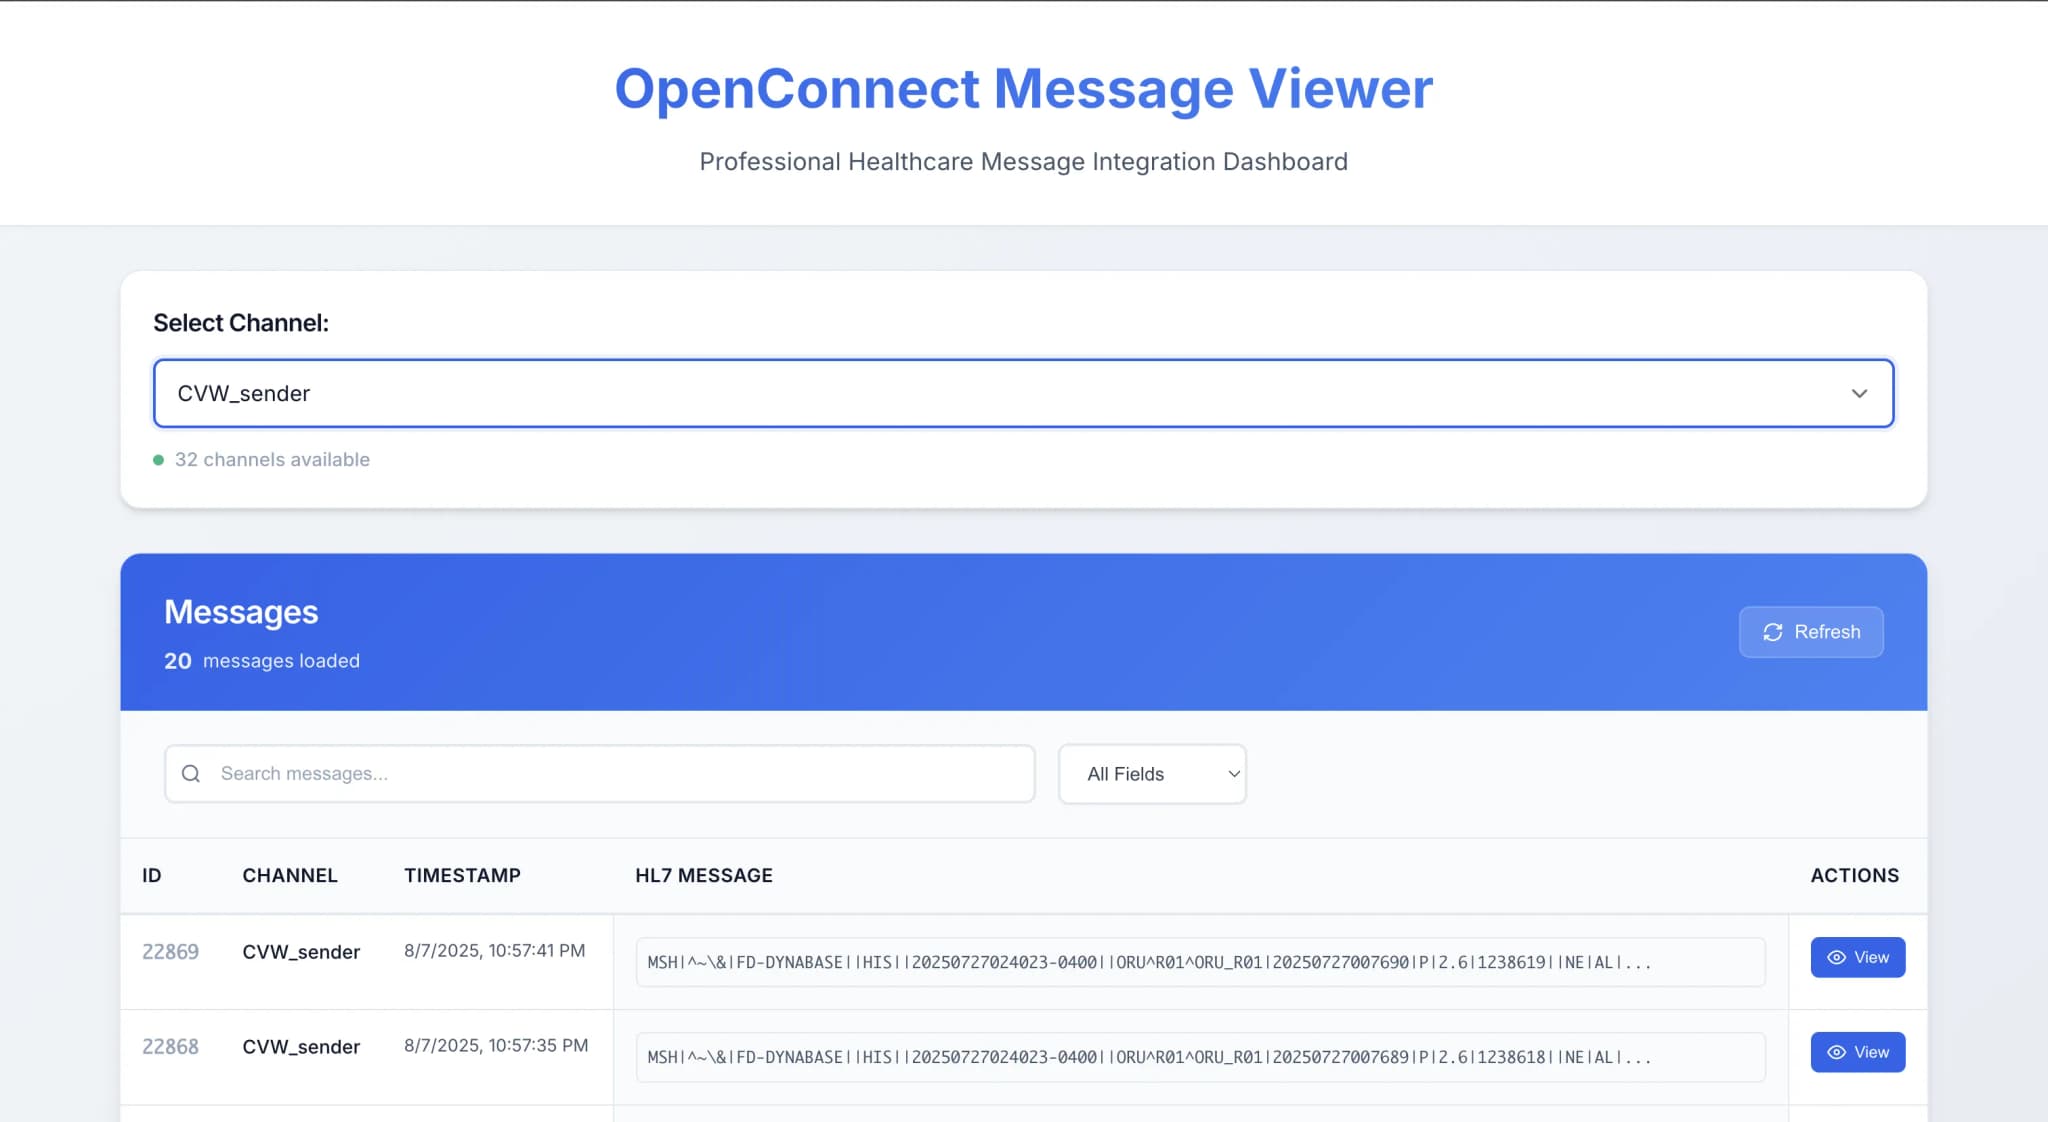
A monitoring dashboard for Mirth Connect, the integration engine hospitals use to route clinical data. Deployed on-premise inside the hospital environment, it watches 32 channels and surfaces failures as they happen.
The Hard Part
Everything runs on-premise in a HIPAA-regulated environment, so the dashboard had to deliver its monitoring without sending clinical data outside the hospital network.
What I Built
- Monitoring dashboard covering 32 Mirth Connect channels
- React front end with a Node.js backend
- HIPAA-conscious on-premise deployment
- Failure visibility that cut MTTR from 3 hours to 30 minutes
The Build
Integration failures are silent by nature
Mirth Connect is the engine hospitals use to route clinical data between systems. Each channel is a pipe carrying a particular kind of message from one place to another, and when a channel stops, nothing dramatic happens. The engine keeps running. The other channels keep working. Messages simply stop arriving somewhere, and nothing about the situation announces itself.
That is what makes this class of failure expensive. A crashed application is obvious to everyone at once; a stalled integration channel is obvious only to whoever eventually needs the data that did not arrive. In a hospital the discovery route is usually a person — someone asks why a result has not appeared, that question travels to IT, and only then does anyone look at the engine. The outage began well before the first person noticed it.
Mirth has its own administrative interface, but it is built for configuring channels rather than for watching them. Answering "is everything flowing right now" across 32 channels means checking them, and checking 32 of anything on a schedule is not something a team with other work does reliably. The gap is not a missing feature in the engine; it is that configuring and monitoring are different jobs and the console is designed for the first.
Why this had to be built rather than bought
Monitoring is a solved problem with a mature market, and essentially none of it was available here. Everything runs on-premise in a HIPAA-regulated environment, and the dashboard had to deliver its monitoring without sending clinical data outside the hospital network — which rules out the entire category of hosted observability, because the defining behaviour of those tools is shipping telemetry to somebody else's infrastructure.
That constraint is stronger than it first appears, because the telemetry itself is sensitive. Integration monitoring is not counting anonymous requests. A failing channel produces errors about specific messages, and those messages carry clinical data — so the diagnostic detail that makes an error useful is exactly the detail that must not leave. Even a hosted tool configured carefully would be one misconfiguration away from a disclosure, which is a risk with no upside in this setting.
So the requirement becomes a design question rather than a procurement one: how much can a dashboard show about a failure while remaining safe to display? Enough to know a channel has stopped, which one, and when — because that is what shortens the response — without turning a monitoring screen into a second place clinical content is visible.
Running inside hospital infrastructure adds the operational constraints that come with it. The people who keep it working are hospital IT rather than the team that built it, updates are infrequent, and nobody is going to attach a debugger from outside. That pushes every decision toward the predictable option and toward failure states that explain themselves on screen.
The dashboard is a detection instrument
The whole product is a single view across all 32 channels showing current state and surfacing failures as they happen. Described that way it sounds modest, and its value comes precisely from being unglamorous: one place, always current, where the question "is anything broken" has a visible answer rather than requiring an investigation.
Covering all 32 rather than a chosen subset is what makes it trustworthy. A dashboard showing the important channels invites the assumption that anything absent is fine, and the failure nobody planned for is by definition on a channel nobody flagged as important. Completeness is what allows an empty alert state to mean something.
A React front end over a Node.js backend is an unremarkable choice, and appropriately so. Nothing here benefits from novelty — the software has to run for long periods inside an environment it cannot be iterated on quickly, and it is watched by people during incidents rather than admired during demos. Boring technology is the correct answer when the deployment target is a hospital and the users are under pressure.
Where the recovered time actually came from
MTTR fell from 3 hours to 30 minutes, and the useful question is which part of those 3 hours disappeared. It was not the repair. Fixing a stalled channel takes about as long as it always did — what collapsed was the time before anyone knew there was something to fix.
That is the whole mechanism, and it is why the recorded capability is failure visibility rather than any repair tooling. In the previous arrangement the clock started when a message failed and the response started when a human noticed, and everything in between was pure latency during which the problem was compounding invisibly. A dashboard that surfaces failures as they happen removes that interval almost entirely, and the reduction in mean time to resolution follows without anything about the fixing getting faster.
The 90% figure for faster issue resolution describes the same improvement from the outcome end. Both numbers point at detection as the bottleneck that was actually removed.
32 channels monitored is the number that gives the other two their meaning. Monitoring a handful of pipes proves little, since a small set is exactly what a person can check by hand. At 32 the manual approach has already failed — not occasionally, but structurally — and a complete automated view stops being a convenience and becomes the only version of the job that can actually be done.
Measured Results
90%
faster issue resolution
3h → 30min
MTTR
32
channels monitored
Tech Stack
More Case Studies
Have a similar project?
I would love to help you build something great. Let's discuss your requirements.